
How to use AI to create better technical diagrams
A practical look at how LLMs can help you generate architecture diagrams without the fluff

As AI tools continue to grow around software engineering—whether it’s for debugging or writing code—one area that still feels a bit overlooked is creating technical diagrams.
“A picture is worth a thousand words,” and in engineering, being able to communicate clearly—whether for future projects (RFPs) or existing architecture—is key.
The challenge is that it’s hard to create technical diagrams that are both clear and sober, without being overly flashy or confusing. Fortunately, AI tools can help you make great diagrams, if you know how.
AI is bad at generating image diagrams (on its own)
The common trap when creating technical diagram is relying on an LLM with a vague prompt like this:
design a technical diagram to helps visualize how microservices or components communicate through events and message queuesIf we run this with ChatGPT from OpenAI :

What you’ll get is usually a generated image—and often, it’s… well, ugly.
To be fair, the image above was generated before March 25, 2025, which was prior to OpenAI’s 4o image generation release.
Here’s the same prompt using the updated model:

Already a big improvement—but honestly, we can still do much better!
These AI models aren’t great at design. But what they are great at is generating code and understanding the relationships between components. That’s what makes them useful for generating diagrams.
We need an intermediate layer between our prompt and the final image: we need code that generates diagrams.
Diagrams as code
There are several frameworks that let you generate diagrams using code.
One popular open-source project is Diagrams, a Python framework that lets you create beautiful diagrams using official cloud icons from AWS, Azure, GCP, and more.

The downside is that it’s Python-based, which can feel a bit heavy depending on your workflow.
In this case, you could prompt an LLM to generate Diagrams code for your desired architecture, then run the Python script to export it as a .png. While it’s possible to streamline the process with CI/CD, there are simpler workflows that offers better developer feedback loop.
💡 You don’t always need AI to generate diagrams.
If you’re already using Terraform, aside from the built-in terraform graph, check out these tools—they generate diagrams based on your Terraform graph:
• Terravision – uses the Diagrams framework
• Terramaid – uses Mermaid for lighter diagrams
Faster iteration with Mermaid
If you’re looking for something more lightweight, Mermaid is a great alternative. It’s another popular open-source framework that lets you write diagrams in a simple syntax.
Because it’s JavaScript-based, it’s easier to integrate into markdown renderers and live editors. There are extensions for Obsidian, VS Code/Cursor, and more.
Let’s try a prompt:
Create an Mermaid schema that explain the high-level architecture and design of Apache Spark. Include the key components such as the driver, executors, cluster manager, and DAG scheduler. Describe how Spark handles job execution, fault tolerance, and memory management. Provide a conceptual overview suitable for a software engineer familiar with distributed systems but new to Spark.You can inspect the result using any Mermaid previewer (here in Cursor):

We still need to update through code for any additional edits. If you want a live editor on the schema itself, you can use mermaid.live or a Cursor/VSCode extension.
But let’s be honest—the editing experience isn’t amazing when it comes to fine-tuning diagrams manually. You’re still dealing mostly with code.
Best human feedback loop with Excalidraw & Cursor
Mermaid is great for simple, lightweight diagrams—but the editor experience is limited because it was built for code → diagram.
On the other side, Excalidraw: an open-source tool built the other way around—from sketching → code. It’s great for quick, hand-drawn-style technical diagrams with just enough structure.
I personally use the Obsidian plugin, and there’s also a great VS Code/Cursor extension.
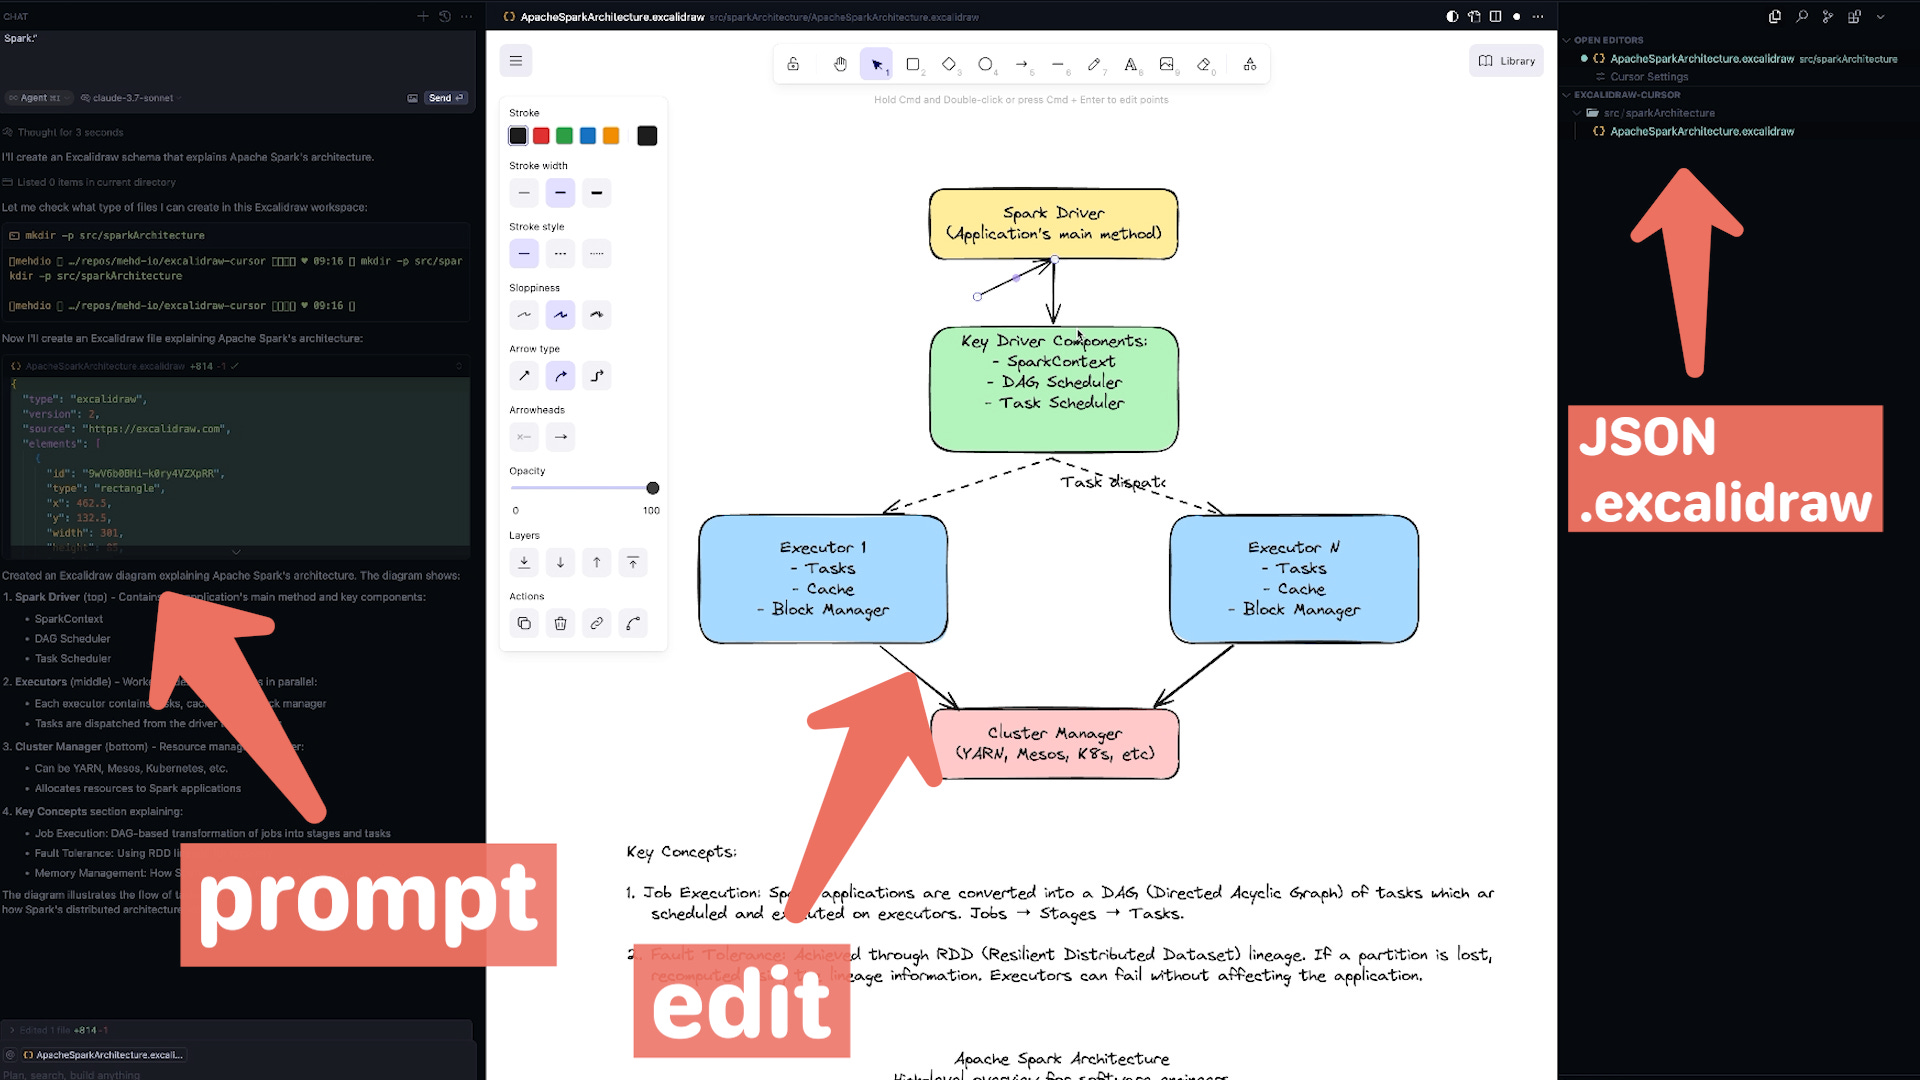
The cool part? Excalidraw diagrams are just JSON:
{
  "id": "VNytcZzbA1rTn2Q5GfXmM",
  "type": "text",
  "x": 622,
  "y": 476,
  "text": "Task dispatch",
  "fontSize": 20,
  ...
}
This structure makes it very AI-friendly. Here’s the same above prompt you can try:
Create an Excalidraw schema that explains the high-level architecture and design of Apache Spark. Include the key components such as the driver, executors, cluster manager, and DAG scheduler. Describe how Spark handles job execution, fault tolerance, and memory management. Provide a conceptual overview suitable for a software engineer familiar with distributed systems but new to Spark.Once the .excalidraw JSON is generated, you can open it in the editor and interact with it manually. This is where AI really shines: it gives you a solid first draft, and you provide the human feedback loop to adjust layout, naming, and connections.
I think this is where creating technical diagram with AI shines : having simple and clear human feedback loop to quickly manually operate.
Sometimes, drawing is faster than getting the perfect prompt.
Until the next experiment 🫡
This is such a helpful breakdown! I've always struggled with making my architecture diagrams look professional without spending hours on design. The idea of using AI to generate the code for Mermaid or Excalidraw is a game-changer. It feels so much more efficient. I'm definitely going to look for a good mermaid flowchart tutorial to get started. Thanks for the practical tips and for showing the specific prompts to use!
https://mermaidviewer.com/
Love it! How complex can the excalidraw diagrams get when using AI?